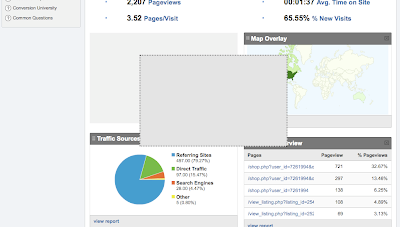
On your dashboard right below the "Site Usage" box you should see some more boxes. If you click and hold on the dark color on the top of each box, it will let you grab the box and you can move it to where ever you would like it to be. If there is a box on your dashboard that you don't want there you can click the little "x" in the upper right hand corner of the box.
The picture below illustrates dragging the "Visitors Overview" box around.

You can also add more boxes showing the information you want most. If you want to add a new box, first navigate to the information you would like to add by accessing the menus on the left of your Google Analytics page. Then click the "Add to Dashboard" button at the top of the screen as shown in the picture below.

Here is a quick example of how to add "All Traffic Sources" to your dashboard:
- Log in to Google Analytics
- Click "Traffic Sources"
- Click "All Traffic Sources"
- Click "Add to Dashboard"
- Now click "Dashboard" and drag it to the location you desire
Don't understand something I wrote about? Have a related question? Post a comment and I will be sure to answer it. Have an unrelated question? Submit it here and I will feature it on my blog!
xoxo
susan.
No comments:
Post a Comment